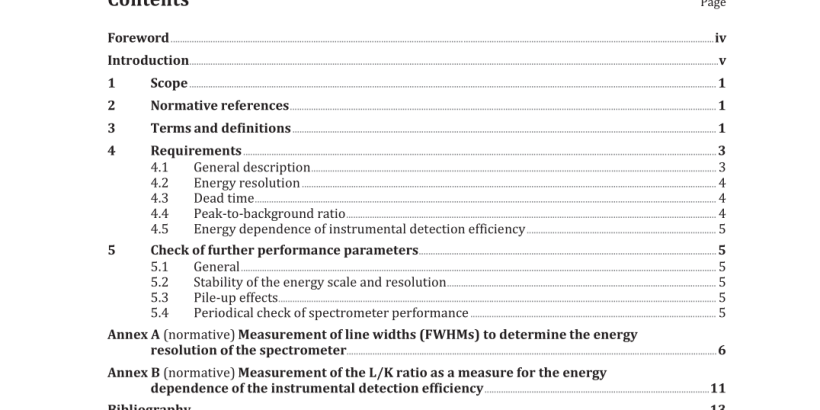
ISO 15632:2021 pdf download – Microbeam analysis — Selected instrumental performance parameters for the specification and checking of energy- dispersive X-ray spectrometers (EDS) for use with a scanning electron microscope (SEM) or an electron probe microanalyser (EPMA).
4.2 Energy resolution The performance of an EDS depends on the pulse processing details. The energy resolution shall be specified as the FWHM of the manganese K α peak and determined in accordance with Annex A . Spectrometers that claim detection of X-rays lower than 1 keV shall also be specified by the FWHM of the carbon K and the fluorine K-lines. The specified FWHM shall be an upper limit in that the resolution determined in accordance with Annex A is guaranteed to be no greater than the specified value. The resolution value shall be accompanied by a statement of count rate for which the specification is valid. For most detector systems the best energy resolution is attained at an ICR < 1 000 counts/s and the best energy resolution shall be specified. Where detector systems offer higher count rate capability, e.g. SDD EDS, the energy resolution shall also be specified at high ICR, e.g. 50 000 counts/s, 500 000 counts/s. 4.3 Dead time In order to evaluate the process time of the EDS, complementary to the energy resolution specified in 4.2 , the corresponding dead-time fraction should be specified. The calculation of the dead-time fraction is given in 3.4. Dead time is a consequence of the electronics rejecting “bad ” measurements in order to achieve high spectrum fidelity. In many systems, the rejection criterion is designed to ensure that the measurement time for each photon is identical. However, it is possible to reduce the dead-time fraction by relaxing the criterion for pulse rejection and allowing the measurement time per photon to vary according to the arrival time of photons (“adaptive filtering ”). In this case, the process time is not defined, the peak shape and resolution will change with count rate and this could cause analytical results to vary with count rate. Therefore, any specification of dead-time fraction should include a description of the essential design elements of the electronics as per 4.1.
4.5 Energy dependence of instrumental detection efficiency The minimum specification for the energy dependence of the instrumental detection efficiency shall be the intensity ratio of a low energy line and a high energy line in the characteristic X-ray spectrum of a given material. This ratio shall be given as the net peak area of the L series lines divided by the net peak area of K α series lines in the spectrum of a pure nickel or copper specimen, excited by a 20 keV electron beam perpendicular to the specimen surface and collected by the detector at a take-off angle of 35°. The specimens to be used, the measurement conditions, the calculation of L/K ratio and its conversion for TOA ≠ 35° are given in Annex B . NOTE 1 These measures are only appropriate for a detector thick enough to absorb at least 95 % of the incident X-ray energy at 8 keV. NOTE 2 If the specimen chamber containing ports to fix the detector does not allow a take-off angle of 35°, the L/K ratio at any other take-off angle can be converted to that for 35° by applying the absorption correction formalism of quantitative electron probe microanalysis (see B.4). 5 Check of further performance parameters 5.1 General The parameters described in 4.2 , 4.3 and 4.5 shall be specified by the manufacturers and checked periodically by the users. In addition, the users may check other parameters and effects which are relevant for the performance of the spectrometer, especially at high count rates.
5.2 Stability of the energy scale and resolution For the range of count rates that will be used in practice, the stability of the energy scale, i.e. of the peak positions, can be checked. For example, the change in centroid position for Mn K α peak over an ICR range of 1 000 to 50 000 counts/s can be evaluated on a periodical basis. For the determination of the peak centroid position only data at or near the FWHM energy locations should be used. The stability of resolution with count rate can also be checked.
